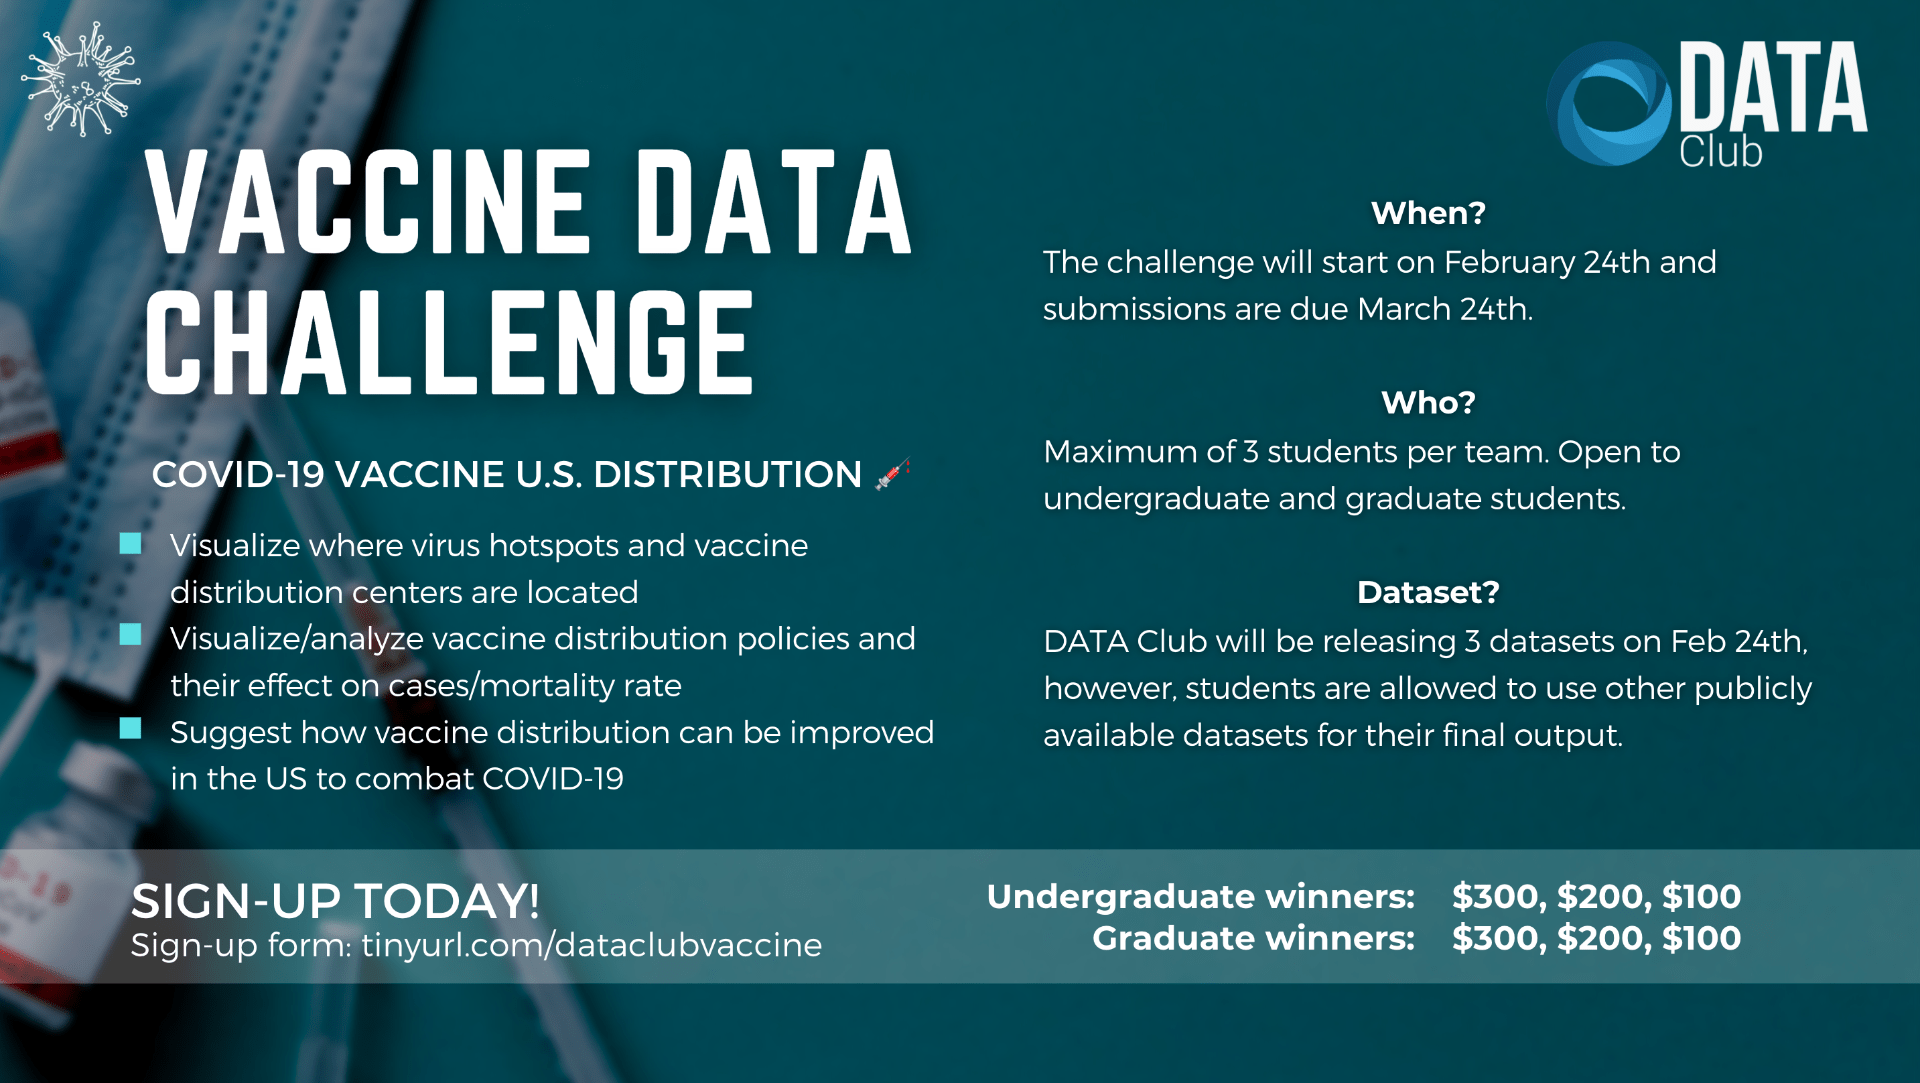
The Vaccine Data Challenge has finished and winners have been declared. Thank you very much to everyone who participated!
Undergraduate Winners:
- Carrie Tam, Benjamin Fox, and Margaret Morehead
- Namrata Ray, Sanjna Ray, and Sach Nehal
- Justin Miller and Paxton Howard
Graduate Winners:
- Jigesh Maurya, Abhinav Shah, and Monika Pawar
- Roger Meng

Challenge Details:
This semester DATA Club is launching a Vaccine Data Challenge, which will challenge students to understand COVID-19 distribution across the United States. The challenge will start on February 24th and submissions are due March 24th at 11:59pm EST. Students are allowed to join at any time so long as they submit their project by March 24th.This competition will be centered around understanding COVID-19 vaccination distribution across the United States.
Students must:
- Visualize where virus hotspots and distribution centers are
- Visualize or Analyze vaccine distribution policies and its effect on cases/mortality rate
- Suggest how vaccine distribution can be improved in the US to combat COVID-19 and how impactful your solution will be
The focus of this challenge is on how the United States should improve current COVID-19 vaccine distribution. We want you to paint a picture of what the current status of COVID-19 is, the state of vaccine distribution, and how this distribution combats COVID-19.
Note: Challenge groups must consist of all undergraduates or all graduate students. Maximum of 3 students per team.
Submission Details
Your final submission will be in the form of an 8 minute video, two-paragraph abstract on your findings, and all visualizations used (pdfs, notebooks, etc.). In the video, you should present your visualizations, analysis, and your plan on how to improve COVID-19 vaccine distribution. Be sure to quantify the impact that your plan will have on vaccine distribution and mortality/infection rates
Dataset sources:
- https://data.cdc.gov/Vaccinations/COVID-19-Vaccine-Distribution-Allocations-by-Juris/saz5-9hgg
- https://www.hhs.gov/coronavirus/covid-19-vaccines/distribution/index.html
- https://www.cdc.gov/nchs/covid19/index.htm under ‘Access Dataset on Data.CDC.gov’
- https://covid19vaccine.health.ny.gov/covid-19-vaccine-tracker
Note: Starter Datasets – participants are allowed to use any public dataset they can find.
Prize Details:
- 1st place: $300
- 2nd place: $200
- 3rd place: $100
Undergraduates and Graduates will be judged and receive awards in separate groups, meaning there will be 6 awards total.
How to win?
There will be 5 judges picked from Northeastern professors and industry professionals.Judging will be focused on 5 criteria:
- Problem Addressed – does the project accurately and understandably convey COVID-19’s prevalence and the impact of vaccine distribution centers
- Creativity – does the project educate the viewer through unique and engaging displays?
- Usefulness- does the project allow for viewers to obtain novel and impactful insights?
- Learning – is the methodology well explained such that the project can be reproduced?
- Originality- does the team go beyond the “out of the box” options that the project framework provides? Is the information presented in a new or uncommon but effective form?
